Introduction
Your site stops working with no warning. Instead of a page, you get a short line of text. It says 429 Too Many Requests. Sometimes it shows up in your dashboard. Sometimes your visitors see it on the front end.
The message sounds scary. It is not a hack. Your database is fine. A 429 error means something counted your requests and said stop. A server, a firewall, or an outside service decided you were asking too often. That counting is called rate limiting.
This matters because the block hits real people too. A shopper loading one product page after another can trip the limit. So can a search engine crawler. If Google keeps getting a 429, it slows down and crawls less of your site. You can lose sales and rankings in the same afternoon.
The trigger is usually dull. A plugin update added a new background job. A cache tool started loading pages in advance. A bot found your login page. A new firewall rule went live with a low limit. None of that looks dramatic. Each one can still push you past a limit.
This guide covers the whole problem. First you will learn what the error looks like, so you know you have the right one. Then you will learn each common cause and why it creates this exact symptom. After that you will work through fixes in a safe order. You start with the quickest check and end with the deepest test. Last, you will set up habits that keep it away.
One fact helps right away. WordPress has no request limit of its own. Core never sends a 429 by itself. So the block always comes from a layer in front of PHP, a security tool, or an outside service. That one fact cuts your search down a lot.
Signs That Show the 429 Too Many Requests Error
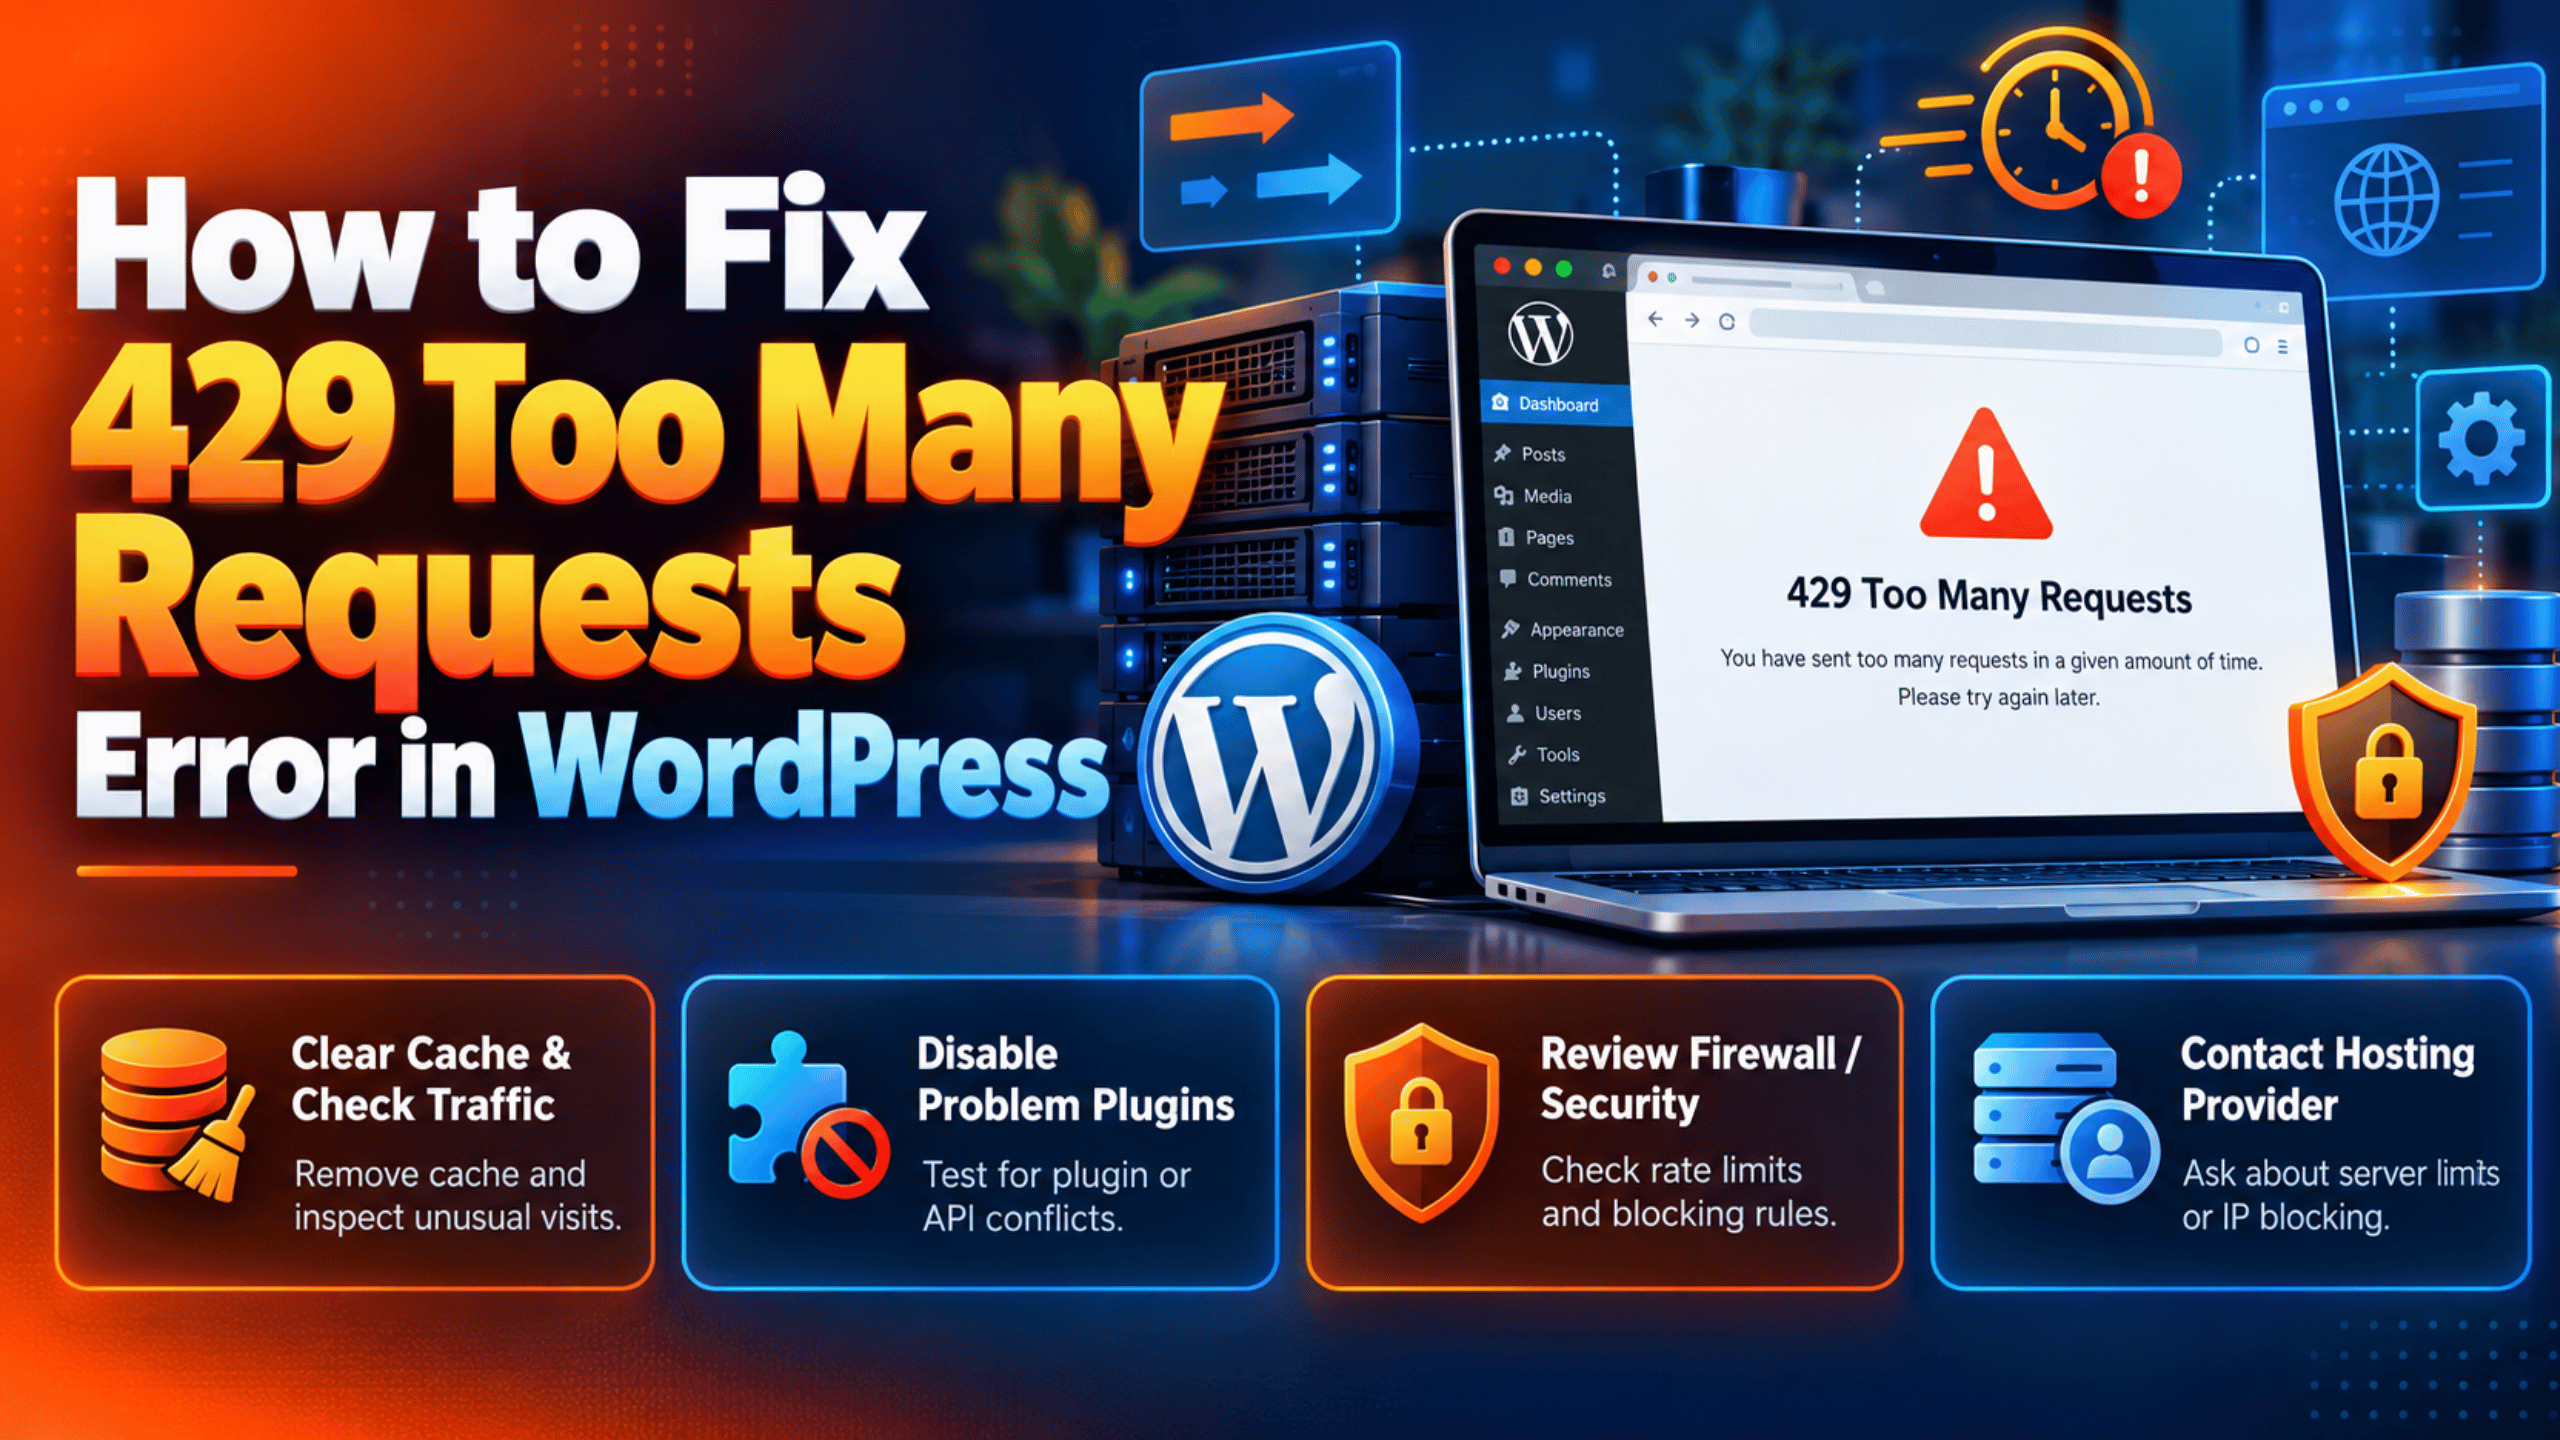
The 429 Too Many Requests error looks plain. You get a short page with the number and a line of text. There is no WordPress styling on it. Your theme is gone. Your menu is gone. That bare look is a clue in itself. It means the request never reached WordPress at all.
The exact wording changes by server. You may see “429 Too Many Requests”. You may see “Error 429”. On some hosts you get a branded page from a firewall. The number is the part that matters.
Watch where and when it shows up. These patterns point to different causes:
- Only in the dashboard. You can browse the public site fine. The admin area fails. That points at admin requests, such as background jobs or editor polling.
- Only on the login page. The front end loads. Logging in fails. That points at bot traffic on your login form.
- Only after fast clicking. You load six pages in a few seconds and it breaks. Then it clears after a minute. That is a per-second limit doing its job.
- Only for you. A friend on mobile data loads the site fine. You cannot. The limit is tied to your own IP address.
- Only inside one plugin screen. The rest of the site is fine. One plugin shows a 429 notice. That plugin is talking to an outside service, and that service is saying no.
- In Google Search Console. Your crawl report lists 429 responses. Visitors never complain. A crawler is being limited while humans are not.
Check the response header if you can. Open your browser tools and look at the Network tab. Click the failed request. A 429 often carries a Retry-After header. That header tells the client how long to wait. If you see it, note the number. A short wait of a few seconds points at a per-second server limit. A long wait of an hour points at a firewall rule or an outside service.
One more check separates 429 from its neighbours. A 503 page means the server is busy or unavailable. A 403 page means you were refused for who you are, not how often you asked. If your page says 503, read our guide to the 503 Service Unavailable error in WordPress instead. If it says 403, start with the 403 Forbidden error guide.
Reasons Why the 429 Too Many Requests Error Happens
Every cause below is a counter somewhere. Something adds up requests over a short window. When the total passes a line, the next request gets a 429. The job is to find which counter is tripping.
Your host enforces a request limit per visitor
Most hosts cap how fast one IP address can hit the site. The cap protects every other site on the server. On nginx this is usually the limit_req module. By default that module answers with a 503. Hosts often change it to 429, because 429 is the honest code for this. Managed hosts run their own version of the same idea. WP Engine, for example, returns a 429 when you exceed the most requests allowed to a page within the last second. It does not publish the exact number, on purpose.
The mechanism is simple. The counter is per IP and per short window. Normal browsing never gets close. A script, a crawler, or a very fast click-through does.
A CDN or firewall rule sits in front of your site
A content delivery network answers requests before your server sees them. If it has a rate limiting rule, that rule fires first. Cloudflare rate limiting rules return a 429 by default. So a rule you set months ago can block you today, once traffic patterns change.
This cause explains the strangest symptom of all. Your server logs look clean. Nothing reached your host. The block happened one layer earlier, so your own logs never recorded it.
WP-Cron runs on every page load
WordPress runs its own scheduled jobs through a file called wp-cron.php. It does not use a real timer. Instead, WordPress checks for due jobs on page loads. To do that it makes an HTTP request back to your own site. That is called a loopback request.
On a quiet site this is harmless. On a busy site it is not. Every page view can start another loopback. Your server ends up calling itself many times a minute, all from the same IP address. That is exactly the pattern a rate limiter is built to stop. The requests are real, so the limit is real, and the 429 is real.
The Heartbeat API keeps the admin area busy
WordPress has a polling feature called the Heartbeat API. It powers things like autosave and post locking. When a page loads, Heartbeat sets up a tick that runs every 15 to 120 seconds. Each tick posts to admin-ajax.php.
One open tab is fine. Six open editor tabs are not. Add a few plugins that hook into Heartbeat and the rate climbs fast. Leave a tab open overnight and it keeps posting. If your limit counts admin requests, you can trip it without touching the keyboard.
Bots hammer your login page and XML-RPC file
Automated scripts guess passwords all day. They target wp-login.php most of all. Many also target xmlrpc.php, an older file that accepts remote posting. XML-RPC is worse than the login page in one way. A single request can carry many login attempts at once.
The bot traffic itself triggers the limit. Then the limit hits you as well, if you share any part of the counter. On some setups the whole site slows down first, then starts returning 429 to everybody.
A plugin calls an outside service too often
Plenty of plugins talk to other companies. A maps block calls a maps service. A social feed calls a social network. A mail plugin calls a sending service. Every one of those services has its own rate limit, and 429 is the standard way to say so.
Here the 429 is not about your server at all. Your site is the client being told off. That is why the error often appears inside one plugin screen, as a notice or a failed sync, while your pages load normally.
Your own tools crawl your site too fast
Some of the heaviest traffic on a site comes from its owner. Cache preloading walks every URL to warm the cache. A sitemap tool crawls to check links. A security scanner reads every file through HTTP. A migration tool pulls the whole site at speed.
All of that traffic comes from one place, fast. A rate limiter cannot tell a helpful tool from a hostile one. It only counts. So your own maintenance job locks you out of your own site.
A loop repeats the same request forever
Sometimes a script gets stuck. A piece of JavaScript asks the REST API for data, fails, and asks again with no pause. A broken block in the editor retries in a tight loop. A badly written job schedules itself over and over.
A loop is the worst case because it never slows down on its own. It can send hundreds of identical requests a minute. You will hit any limit, on any host, within seconds.
How to Fix the 429 Too Many Requests Error in WordPress (Step by Step)
Work through these steps in order. They run from the fastest, safest check to the deepest test. Stop as soon as the error clears. Before you start, do one quick thing. Wait two minutes and reload the page. Most limits reset on their own. If the page comes back by itself, you are looking for something that repeats, not something that broke.
Keep a note open as you go. Write down which step you tried and what you saw. That record saves time if you need to hand the problem to your host.
Step 1: Ask your host whether you are being rate limited
This step addresses the host limit cause. Your host counts requests per IP over a short window. Normal browsing stays under it. Anything automated can pass it, and then the next request is refused before WordPress loads.
Confirm it first. Open your hosting dashboard and find the access log for your site. Look for lines with a 429 status code. Note the IP address and the path on those lines. If the IP is yours, the limit is reacting to you. If the IP is unknown and the path is the login page, a bot is the cause instead, and Step 6 is your step. If your host gives you no log, open a support ticket and ask one direct question. Ask whether a rate limit was applied to your site in the last hour, and for which IP.
Now act on the answer. If your own IP is blocked and you were not running anything heavy, ask the host to clear the block and tell you the threshold. If a legitimate service is blocked, such as a payment callback or a monitoring tool, ask for that IP to be allowed through. Most hosts will add an allowance for a named service.
Verify it worked. Reload the page that failed. Then load five more pages in a row at normal speed. If the error stays away for ten minutes of ordinary use, the block is cleared. If it returns within seconds, something on your site is still generating traffic. Carry on to the next step.
Step 2: Check your CDN or firewall rules
This step addresses the CDN cause. A rate limiting rule at the edge answers before your server does. Cloudflare rules return 429 by default, so a rule is the single most likely source of a clean 429 with no trace in your server log.
Confirm it first. Check whether any service sits in front of your site. Sign in to your CDN or firewall account and open the rate limiting section. Read every rule that is switched on. For each one, note the path it watches, the number of requests it allows, and the time window. A healthy rule for a normal site allows well over 100 requests a minute from one visitor. A rule that allows 10 a minute will block real people. If you find a rule set that low, you have found your cause.
Now act on it. Raise the threshold to a number that fits real browsing. Narrow the path so the rule watches only what it needs to, such as the login form, rather than the whole site. Add your own office IP to the rule’s exceptions so you are never locked out of your own dashboard. If you cannot tell which rule is firing, switch rules off one at a time and test between each change. Turn each one back on before you move to the next.
Verify it worked. Most CDNs log every blocked request. Open that log and filter for 429. Browse your site normally for a few minutes, then refresh the log. If no new 429 entries appear, the rule is no longer firing on normal traffic.
Step 3: Stop your own tools from crawling too fast
This step addresses the self-crawling cause. Cache preloading, link checking, security scans, and migrations all read many URLs quickly from one source. A limiter counts those the same as an attack.
Confirm it first. Think about timing. Did the error start right after you installed or set up a cache plugin, a broken link checker, an SEO scanner, or a backup and migration tool? Check each tool’s own log or report page for failed requests. Then try the direct test. Switch off the preloading or scanning feature, clear the limit by waiting a few minutes, and browse the site. If the error does not return, that tool was the source.
Now act on it. Most tools let you slow down. In a cache plugin, look for the preload setting and either turn it off or reduce how many URLs it loads at once. In a link checker, reduce the checks per hour. In a security scanner, lower the scan speed or set it to run at a quiet time of night. For a migration or backup, run it from the server side if your host offers that, rather than over HTTP.
Verify it worked. Leave the tool running at its new setting for an hour. Watch your access log for fresh 429 lines. If none appear and the tool still finishes its job, the setting is right. If the error comes back, the tool is not your only source, so move on.
Step 4: Move WP-Cron to a real server schedule
This step addresses the WP-Cron cause. WordPress fires its scheduled jobs by calling your own site over HTTP on page loads. On a busy site that creates a stream of requests from your server to itself, all from one IP.
Confirm it first. Open your access log and look for requests to wp-cron.php. Count how many you see in one minute. A handful an hour is normal. Dozens a minute is your problem. You can also open Tools and then Site Health in your dashboard. If the loopback request test fails or warns there, cron traffic is already struggling.
This step edits a core file, so protect yourself first. Take a full backup before you touch anything, or make the change on a staging copy. Our guide to backing up WordPress with UpdraftPlus walks through that. A typo in this file can take the whole site down.
Now act on it. Edit wp-config.php in your site’s main folder. Above the line that says “That’s all, stop editing”, add this:
define( 'DISABLE_WP_CRON', true );That stops WordPress from firing cron on page loads. Your scheduled jobs will now never run, so you must replace them at once. In your hosting control panel, find the cron jobs tool and add one job that loads your cron file. On a Linux host the command looks like this, run every fifteen minutes:
wget --delete-after https://example.com/wp-cron.phpSwap in your own domain. Many managed hosts offer a one-click setting for this instead, so check for that first.
Verify it worked. Install nothing new. Instead, watch your access log for a few minutes. Requests to wp-cron.php should drop to almost none, then appear once at your chosen interval. Then check that scheduled work still happens. Save a scheduled post for five minutes ahead and confirm it publishes. If scheduled posts stop working, your server cron job is not running, and you should re-check the command.
Step 5: Slow down the Heartbeat API
This step addresses the Heartbeat cause. Heartbeat posts to admin-ajax.php every 15 to 120 seconds from every open admin tab. With several tabs open, or several plugins hooked in, that adds up quickly.
Confirm it first. Open any post editor and leave it alone. Open your browser tools and watch the Network tab. You should see a repeating request to admin-ajax.php. Time the gap between two of them. If the gap is 15 seconds and you keep many tabs open all day, Heartbeat is a real contributor. Then check your access log and count admin-ajax.php requests per minute. Compare that with the limit your host told you about in Step 1.
Now act on it. The simple route is a Heartbeat control plugin. Install one from the plugin directory, then set the frequency in the dashboard and editor to 60 seconds rather than 15. Leave Heartbeat switched on in the post editor. Turning it off there costs you autosave and post locking, which is a bad trade. You can safely slow it down everywhere else. The other half of the fix costs nothing. Close admin tabs you are not using, and ask your team to do the same.
Verify it worked. Reload the editor and watch the Network tab again. The gap between requests should now match the value you set. Check your access log and count admin-ajax.php hits per minute once more. The number should be clearly lower. If the dashboard still returns 429, something other than Heartbeat is driving admin traffic, so continue.
Step 6: Shut down bot traffic on login and XML-RPC
This step addresses the bot cause. Scripts guess passwords against your login page and your XML-RPC file. That traffic alone can hold your site at its limit all day.
Confirm it first. Search your access log for requests to wp-login.php and xmlrpc.php. Count how many you see in an hour, and check whether they come from many different IPs. A real login page gets a few requests an hour. Hundreds an hour, from addresses all over the world, is an attack. If most of the 429 lines in your log sit next to those two paths, this is your cause.
Now act on it. Start with the measures that carry no risk. Add two-factor login to every admin account, so guessed passwords are worthless. Add a login limit plugin so repeated failures from one IP are blocked at the WordPress layer, before your host’s counter is involved. If you do not use XML-RPC, turn it off. Many security plugins have a single switch for that, which is far safer than editing files. Only block XML-RPC at the server level if you are sure nothing depends on it. Some mobile apps and older remote tools still use it.
If you decide to block a path in your server settings, treat it as a risky edit. Back up first, and keep a copy of the original file. A bad rule in .htaccess or an nginx file can lock everyone out, including you.
Verify it worked. Watch your access log for an hour. Failed login requests should now be answered by your plugin rather than reaching your host’s limit. The 429 lines next to those paths should stop. Confirm you can still log in yourself, from a fresh browser window, before you close the job.
Step 7: Find the plugin calling an outside service too often
This step addresses the outside service cause. Your site is the client here. A service you depend on is refusing extra calls, and the plugin reports that refusal as a 429.
Confirm it first. Note exactly where the error appears. If pages load fine but one plugin screen shows a 429 notice or a failed sync, this is your cause. Open that plugin’s own log or status page. Many record the full response from the service, including the wait time it asked for. Check the service’s own dashboard too. Most show your usage against your allowance for the current period. If you are at your cap, you have your answer with no guessing at all.
Now act on it. Your options depend on the plugin. Look for a sync interval or refresh setting and make it less frequent. Look for a caching option, so results are stored instead of fetched again on every page view. If the plugin pulls a feed on every visitor’s page load, that is the setting to change first. Some services sell a higher allowance on a paid tier. That is a business decision for the site owner, not a technical fix. If the plugin has no way to slow down, look for an alternative that does.
Verify it worked. Use the plugin feature that failed. The notice should clear and the data should load. Check the service dashboard again after a day and compare your usage with the day before. It should be clearly lower. If usage has not moved, the setting you changed was not the one making the calls.
Step 8: Trace a repeating request loop
This step addresses the loop cause. A stuck script repeats the same request with no pause. It is the only cause that can trip a limit within seconds of a fresh start, every single time.
Confirm it first. Open the page where the error appears. Open your browser tools and watch the Network tab from the moment the page loads. A loop is obvious once you look. You will see the same URL repeating many times a second, usually a REST API path under /wp-json/. Also check your browser Console tab for a repeating error message. Then check your access log for the same path appearing hundreds of times in a minute.
Now act on it. Find the plugin or theme behind the repeating request. Work on a staging copy for this, because you will be switching things off. Switch off all plugins, then load the page and watch the Network tab. If the loop stops, switch plugins back on one at a time, testing after each one, until the loop returns. The last one you enabled is the culprit. If the loop survives with every plugin off, switch to a default theme such as Twenty Twenty-Four and test again. That tells you the theme is at fault.
Once you know the source, update it first. A loop is usually a bug, and bugs get fixed. If an update is available, apply it on staging and retest. If there is no update, report the loop to the developer with the repeating URL you captured. Keep the plugin switched off until it is fixed. Our guide to fixing a slow WordPress admin dashboard covers the same conflict-testing method in more detail.
Verify it worked. Reload the page with the Network tab open. The repeated request should be gone, or should now appear once. Browse for ten minutes and watch your access log. No new 429 lines should appear. If you reach the end of this step and the error is still there, send your host the notes you have kept. You will have ruled out everything you can reach, and that record makes their job much faster.
Best Practices to Prevent the 429 Too Many Requests Error in Future
Each habit below shuts down one of the causes above. Together they keep your request rate inside the limits you have.
Know your limits before you need them
This closes off the host limit cause. Ask your host, in writing, what request rate they allow and how a block is applied. Save the answer where your team can find it. Then you can judge a new tool before you switch it on, instead of after it locks you out. If you have outgrown the plan, you will also know, because the allowance will look small next to your real traffic.
Keep a real server cron and check it
This closes off the WP-Cron cause. Once you have moved cron to a server schedule, keep it that way. Check it every few months by scheduling a post and watching it publish. A silently broken cron job is worse than loud cron traffic. Backups stop, updates stop, and nothing tells you.
Keep Heartbeat tuned and tabs closed
This closes off the Heartbeat cause. Review your Heartbeat setting whenever you add a plugin that works in the dashboard. Keep editor Heartbeat alive, because you want autosave. Make it a team habit to close admin tabs at the end of the day. That one habit removes a steady background load.
Harden the login door permanently
This closes off the bot cause. Bots never stop looking, so the defence has to stay up. Keep two-factor login on for every account with admin rights. Keep a login limit plugin active. Keep XML-RPC off if nothing you use needs it. Review who has an admin account twice a year and remove the ones nobody uses.
Schedule heavy jobs for quiet hours
This closes off the self-crawling cause. Set cache preloading, scans, and link checks to run when traffic is low. Stagger them so two never run together. Then your own maintenance never competes with your customers for the same allowance.
Watch your plugins’ outside calls
This closes off the outside service cause. When you install a plugin that talks to another company, find its usage dashboard on day one. Check it after a week. Set up an alert if the service offers one. Catching a climbing usage curve early is far easier than untangling a cap you have already hit.
Set firewall rules with real numbers
This closes off the CDN cause. Write rate limiting rules around measured traffic, not guesses. Point them at the paths that actually get attacked, such as the login form, rather than the whole site. Always add your own IP as an exception. Review the rules whenever your traffic changes a lot.
Monitor, back up, and test on staging
This closes off the loop cause, and it protects every fix above. Run an uptime monitor so you hear about a 429 before your customers do. Keep automatic backups, and check that one can actually be restored. Update plugins and themes on a staging copy first, then move the change across. A loop found on staging costs you an afternoon. The same loop found live costs you sales.
Conclusion
A 429 Too Many Requests error is a counter saying stop, not a broken site. You can tell it apart by its bare page, by the number itself, and by the Retry-After header in your browser tools. The pattern of when it appears tells you a lot before you change anything. Dashboard-only, login-only, and one-plugin-only each point somewhere different.
The causes all come down to request volume from one source. Your host’s per-IP limit, a CDN rule, WP-Cron loopbacks, Heartbeat polling, login bots, a plugin calling an outside service, your own crawling tools, and a stuck request loop. WordPress itself never sends a 429, so the counter is always somewhere you can go and look at.
The fix process follows the same order every time. Ask your host and read your logs. Check your CDN rules. Slow your own tools down. Move cron to a real schedule. Tune Heartbeat. Shut the login door on bots. Find the plugin calling out too often. Trace any loop. Confirm each cause applies before you change a setting, and verify after every change, so you always know what fixed it.
Prevention is mostly about knowing your numbers and keeping heavy work out of peak hours. Learn your host’s limit. Keep server cron healthy. Keep Heartbeat sensible and tabs closed. Keep login hardened. Schedule scans for quiet times. Watch the services your plugins depend on. Write firewall rules from real data. Back up, monitor, and test on staging before anything reaches your visitors.
Upload problems have a close cousin worth knowing about. Sometimes a file is refused for its size, not for how often you asked. For that case, read our guide to fixing the 413 Request Entity Too Large error in WordPress. For a different server-side failure in the same family, see our guide to the 500 Internal Server Error in WordPress. If you want to read the standard itself, the MDN reference for 429 Too Many Requests and the Cloudflare rate limiting rules documentation are both worth a read.

James is an experienced WordPress and WooCommerce specialist with over 10 years of practical experience. At WPChatSupport, he creates clear guides that help website owners fix WordPress issues, improve speed, secure their sites, and manage WooCommerce stores with confidence. His expertise includes store setup, plugin configuration, theme customization, payment gateway integration, and website troubleshooting. Through simple and helpful content, James supports users in solving technical problems and following best practices for online business growth.