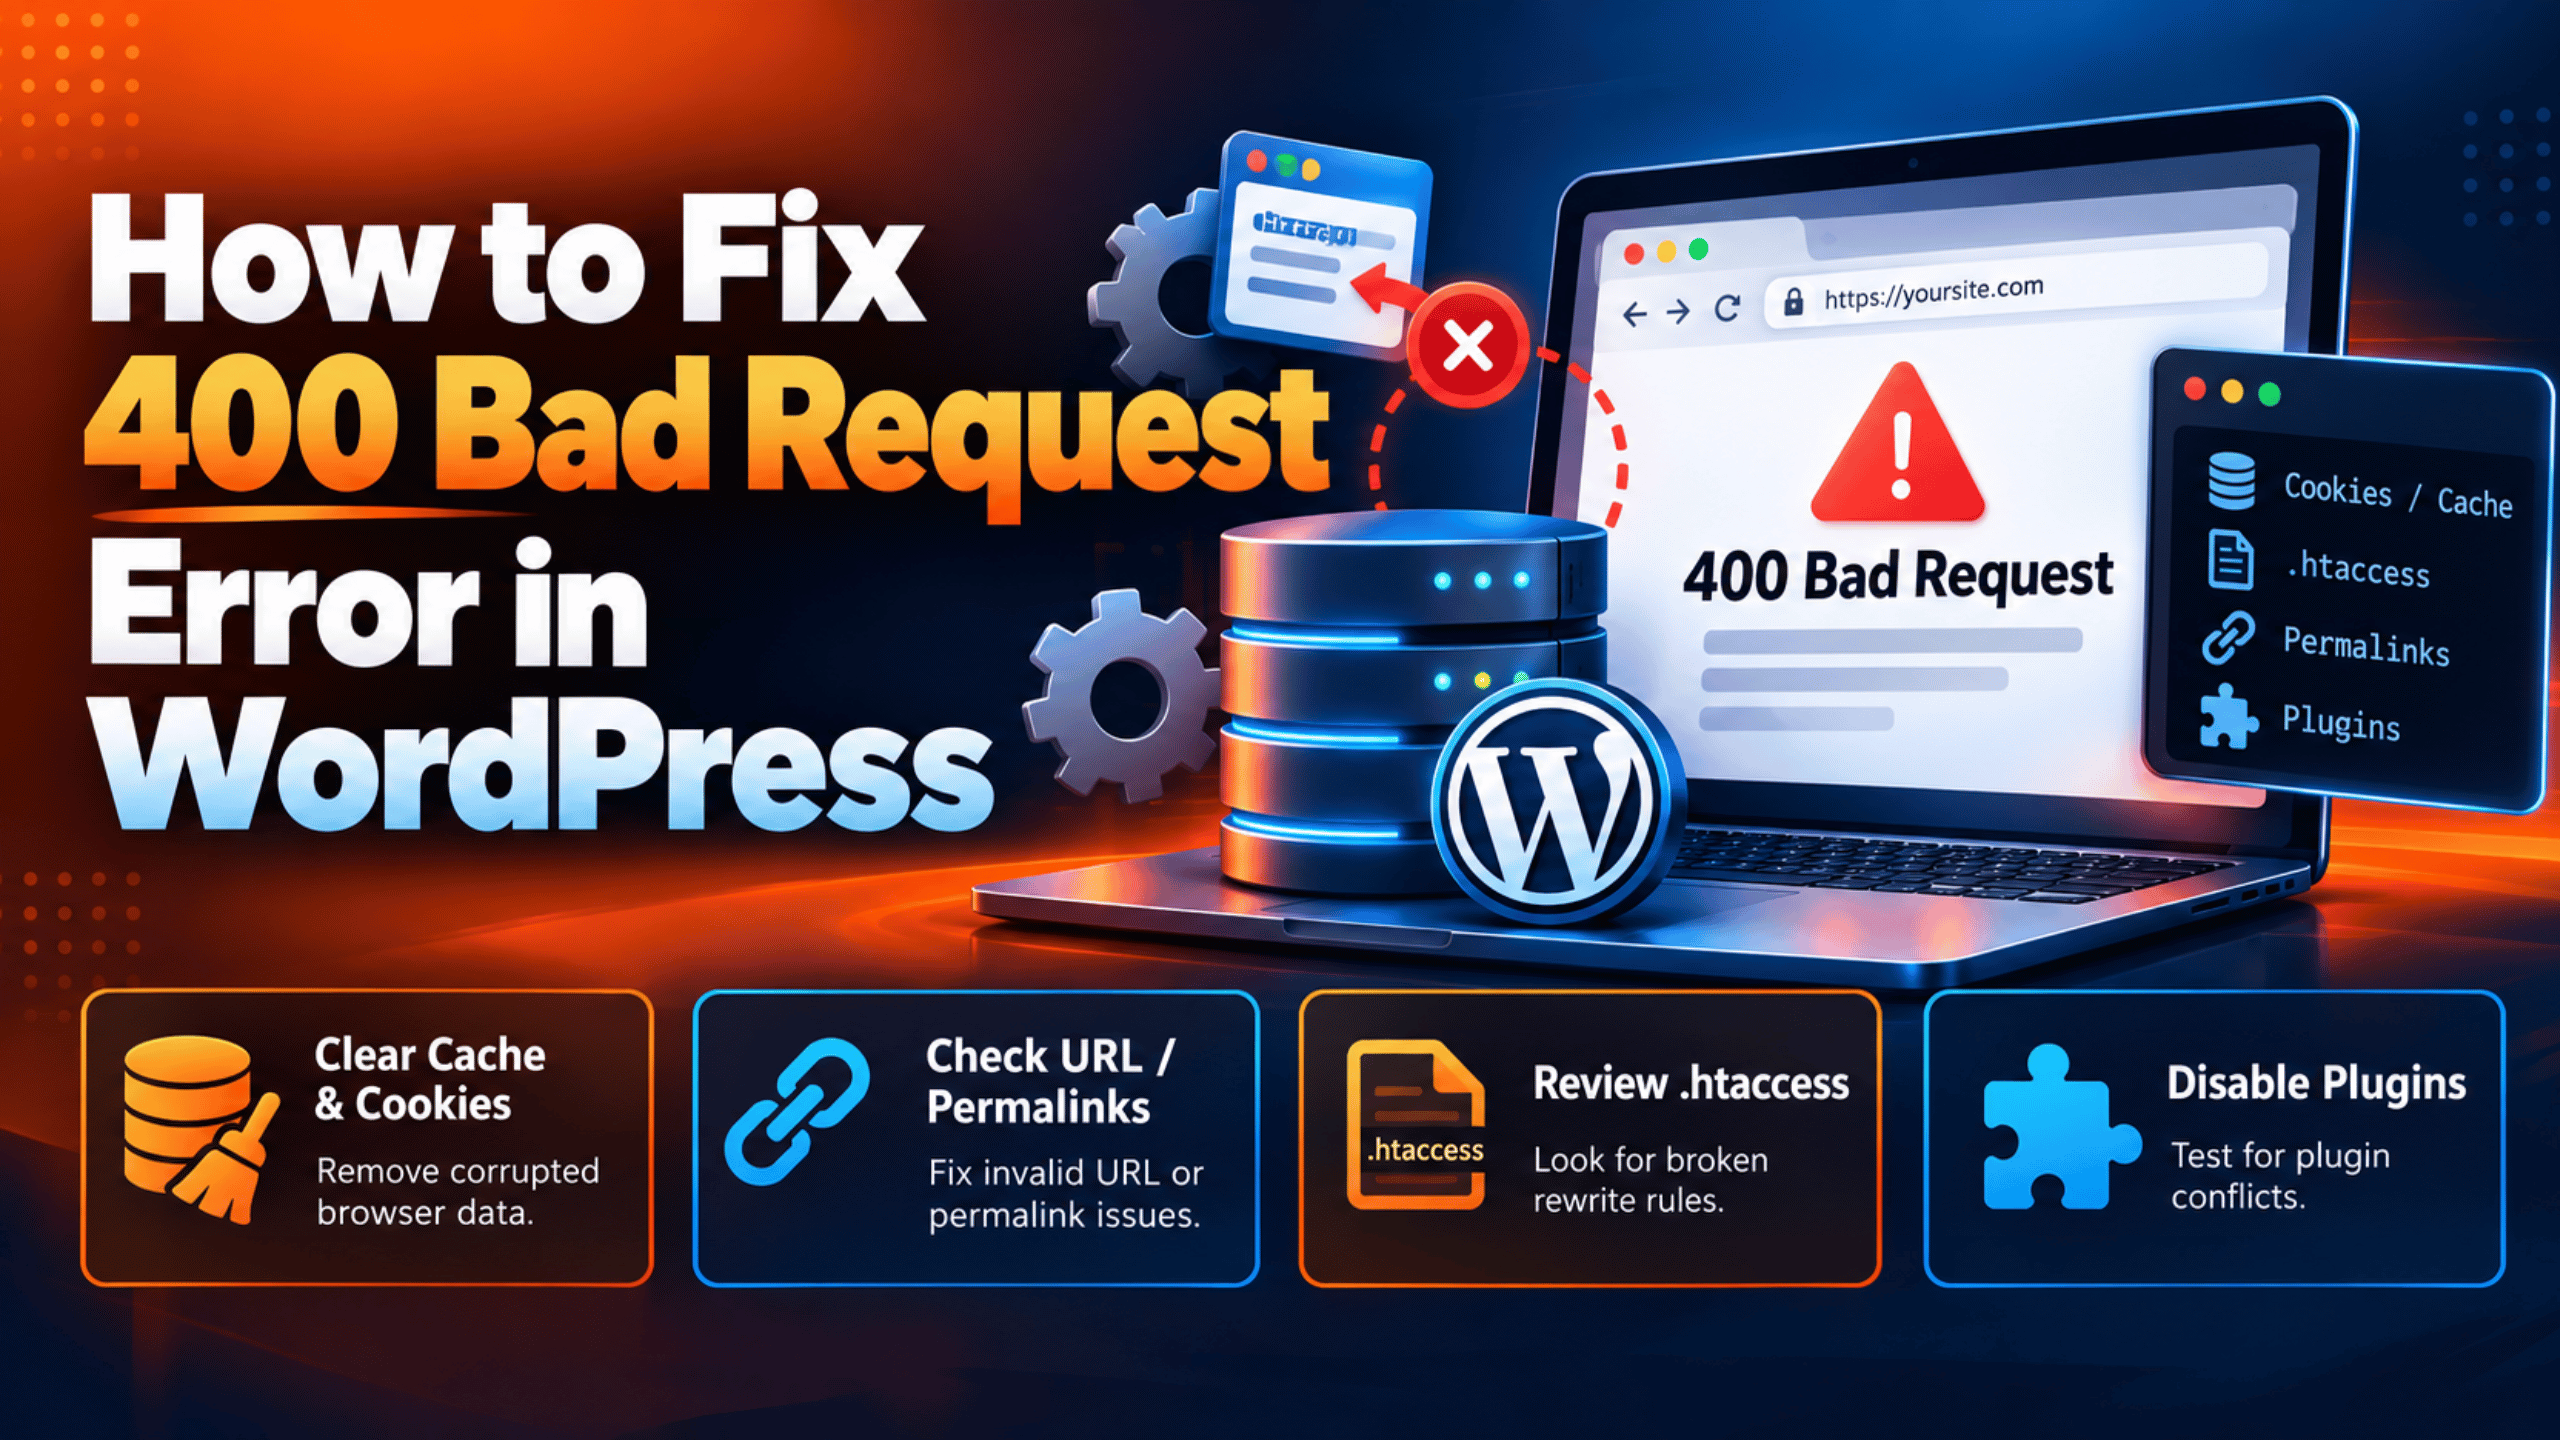
Introduction
You open your website and the page refuses to load. Instead you see a short line that says 400 Bad Request. There is no theme, no menu, and no content. The message is blunt and it explains almost nothing. Many site owners assume WordPress has crashed.
In most cases WordPress never even ran. The 400 status code means the server could not understand the request. Your browser sent something the server judged to be broken. So the server refused it at the front door. That is why you see a bare server page instead of a WordPress design.
This error matters for two reasons. It can lock you out of your own dashboard. It can also hit real visitors and cost you sales or sign-ups. Often one person sees it while everyone else browses happily. That uneven pattern is what makes the error so confusing.
The usual triggers are small and easy to miss. Stale cookies in one browser are the most common cause. A mistyped address, a strict firewall rule, or an oversized request header can also do it. A CDN or a stale DNS record can trigger it too. This guide covers the signs, the real causes, and a safe step-by-step fix. It finishes with habits that stop the error coming back.
Signs That Show a 400 Bad Request Error in WordPress
Several WordPress errors look alike in the browser. Checking the signs first saves you hours of wasted work. Here is what this specific problem looks like.
The clearest sign is the wording on the page. You will see 400 Bad Request, sometimes with a server name underneath. Nginx often adds a second line such as Request Header Or Cookie Too Large. Apache may instead say the request syntax was malformed. The page is plain text on a white background. It carries no WordPress branding at all.
The second sign is how narrow the fault is. Very often only one browser is affected. Open the same address in a private window and the site loads fine. Try a phone on mobile data and it also loads. That split points straight at browser-side data such as cookies.
A third sign appears when only the dashboard breaks. The public pages load, but /wp-admin returns the error. This happens because logged-in visitors carry extra WordPress cookies. Those cookies make the request header larger. The front end stays below the limit while the dashboard goes over it.
A fourth sign shows up inside the block editor. The post looks fine but saving fails. You see a notice such as “Updating failed” and nothing is stored. Open your browser developer tools and look at the Network tab. A request to the WordPress REST API will be marked with status 400.
Finally, check that you are not looking at a lookalike error. A 403 Forbidden error means the server understood you and refused anyway. A 401 Unauthorized error means the server wants you to log in. A 413 means your upload was too big, and a 414 means the web address itself was too long. Only 400 means the request was judged malformed.
Reasons Why the 400 Bad Request Error Happens in WordPress
A 400 response always comes from the web server, not from WordPress. Below are the real causes and what breaks in each one.
Corrupted or Oversized Cookies for Your Site
Your browser stores cookies for every site you visit. It then sends all of them back on every single request. WordPress adds login cookies, and plugins add their own. Analytics, consent banners and carts add more again. Together they can push the Cookie header past the server limit. The server cannot fit the header in its buffer, so it answers 400. A single damaged cookie value can cause the same refusal.
A Malformed Web Address
Web addresses only allow a fixed set of characters. Anything else must be percent-encoded, like %20 for a space. If an address contains a stray percent sign, the encoding breaks. The server then cannot parse the path or the query string. It gives up and returns 400 Bad Request. Broken theme code and bad redirects can both produce addresses like this.
Request Header Limits on Your Server
Every web server caps how large a request header may be. Apache uses a setting called LimitRequestFieldSize, which defaults to 8190 bytes. It also caps the number of header fields at 100 by default. Nginx uses large_client_header_buffers, which defaults to four buffers of 8 KB each. One header field must fit inside one buffer. When a field is bigger, nginx returns 400 to the client. Long cookies, long referrer values and long authentication tokens all eat into that space.
A Security Plugin or Server Firewall Blocking the Request
Security tools inspect requests before WordPress sees them. A web application firewall looks for patterns that resemble an attack. Some rules reject anything with unusual characters in the query string. When a rule fires, the request is dropped with a 400 status. False positives are common after a rule update. Your own legitimate traffic can be caught by mistake.
A REST API Request With a Missing or Invalid Value
The block editor talks to WordPress through the REST API. Each endpoint declares which values it accepts. If a required value is missing, the API refuses the request. If a value is the wrong type, it refuses it too. In both cases the API answers with status 400. A badly written plugin or a stale cached script is usually behind this.
A Stale DNS Record or Hosts File Entry
Your computer caches the server address for every domain. After a host migration that cached record can be wrong. Your browser then sends the request to the old server. That server no longer serves your domain name. Many servers reject an unknown host name with a 400 response. An old line in your computer’s hosts file does the same thing.
A Browser Extension or a Cached Bad Response
Browser extensions can rewrite requests before they leave your computer. Some add headers, and some change the address. A badly behaved extension can produce a request the server rejects. Browsers also cache error pages for a short time. So you can keep seeing 400 after the real fault is gone. This is why the same page can look broken on one machine only.
A CDN or Reverse Proxy in Front of WordPress
Many sites sit behind a CDN or a reverse proxy. That layer has its own header and request limits. It also adds extra headers of its own to every request. Those additions can push the request over the limit further down the chain. The proxy may also reject a request it considers malformed. In that case WordPress never receives the request at all.
How to Fix the 400 Bad Request Error in WordPress (Step by Step)
Work through these steps in order. They start with safe browser checks and move towards server settings. Each step tells you how to confirm the cause, what to change, and how to verify the result. Some later steps edit server files, so take a full backup before you start. A plugin such as UpdraftPlus makes that quick.
Step 1: Clear the Cookies Stored for Your Site
This step fixes the oversized or corrupted cookie cause. Your browser sends every cookie for your domain on every request. When that pile grows past the server header limit, the server answers 400. That is also why the error follows one computer around.
Confirm the cause before you change anything. Open your site in a private or incognito window. A private window starts with no cookies at all. If the site loads there, cookies in your normal window are the problem. If it still fails, skip ahead to Step 2.
Now clear the cookies for that one domain. In Chrome, open the padlock icon in the address bar and choose the cookies and site data option. Pick your domain and delete its stored data. In Firefox, open the privacy settings and manage cookies and site data. Search for your domain and remove it. Clearing only your domain keeps you logged in everywhere else.
Verify the fix by closing every tab for the site and reloading it. The page should now load normally and ask you to log in again. If the error returns within a few minutes, your site is setting far too many cookies. Move on to Step 7 and raise the header limit, then review your plugins.
Step 2: Check the Web Address for Invalid Characters
This step addresses a malformed web address. Servers only accept a limited character set in a URL. A broken percent-encoding makes the address impossible to parse. The server stops reading and returns 400 before WordPress loads.
Confirm the cause by reading the address bar slowly. Look for stray percent signs, spaces, curly quotes or doubled slashes. A healthy address uses only letters, digits, hyphens, slashes and simple query values. Try typing your home page address by hand instead of pasting it. If the home page loads and one specific link does not, that link is the fault.
Fix the link at its source. If the bad address came from a menu, open your menus screen and correct the item. If it came from inside post content, edit the post and relink the text. If it came from a redirect rule, open your redirect plugin and correct the target. Replace any special character in a slug with a plain hyphen.
Verify by loading the corrected link in a fresh tab. The page should open without any server message. If every address fails, including your plain home page, the problem is not the URL. Continue to Step 3.
Step 3: Clear Your Browser Cache and Test Without Extensions
This step covers browser extensions and cached error pages. Extensions can rewrite requests before they leave your computer. Browsers also keep error responses for a short while. Either behaviour can show you a 400 that no longer exists on the server.
Confirm the cause with two quick tests. First, load the site in a second browser you rarely use. Second, open a private window with extensions disabled. Most browsers block extensions in private mode by default. If the site loads in either test, your main browser profile is at fault.
Clear the cached files for your browser next. Choose the option to delete cached images and files, and keep your passwords. Then turn your extensions off as a group and reload the site. Switch them back on one at a time to find the culprit. Security, privacy and ad-blocking extensions are the usual offenders.
Verify by reloading your site with a hard refresh. Hold Shift and click reload to bypass the cache. If the page now works, remove or reconfigure the extension you identified. If the error persists in every browser and on your phone, the fault is on the server side. Go to Step 4.
Step 4: Flush Your DNS Cache and Check Your Hosts File
This step addresses a stale DNS record or hosts file entry. Your computer remembers which server answers for your domain. After a migration that memory can point at the old server. The old server does not recognise your domain and rejects the request.
Confirm the cause before changing anything. Ask a colleague on a different network to load the site. You can also switch your phone to mobile data and try again. If the site works elsewhere but not on your machine, your local records are stale. This is very likely if you recently changed hosts.
Flush the cache on your own computer. On Windows, open Command Prompt as an administrator and run ipconfig /flushdns. On macOS, open Terminal and run sudo dscacheutil -flushcache followed by sudo killall -HUP mDNSResponder. Then open your hosts file and look for any line naming your domain. Developers often add such a line during a migration and forget it. Remove that line, save the file, and restart your browser.
Verify by loading the site again in a new window. It should resolve to your live server and open normally. If you still see the error on every device, your local records were never the cause. Continue to Step 5.
Step 5: Test Whether a Security Plugin Is Blocking the Request
This step addresses a firewall or security plugin false positive. These tools examine requests before WordPress handles them. A rule that looks for attack patterns can match harmless traffic. The request is then dropped with a 400 status.
Confirm the cause by reading the security log first. Most firewall plugins keep a list of blocked requests with a timestamp. Open that log and look for an entry matching the moment the page failed. The entry usually names the rule that fired. That tells you the block was deliberate, not accidental.
Now test with the protection paused. Changing security settings on a live site carries real risk. Take a backup first. Work on a staging copy if you have one. Use your plugin’s own option to disable the firewall temporarily. If you cannot reach the dashboard, rename the plugin’s folder over SFTP to switch it off. Reload the page, then add an allow rule for the pattern that was blocked. Switch the firewall back on straight away once you have your answer.
Verify by repeating the request that failed. It should now complete without a server message. Tell your host if the block came from a server-level firewall rather than a plugin. Only they can adjust rules that sit outside WordPress. If pausing the plugin changed nothing, move to Step 6.
Step 6: Bypass Your CDN or Proxy and Test the Origin Server
This step addresses a CDN or reverse proxy rejecting the request. That layer applies its own limits and adds its own headers. Those extras can tip a request over a limit further along the chain. Sometimes the proxy itself decides the request is malformed.
Confirm the cause by looking at who sent the error. A CDN usually brands its own error pages or includes a reference code. If the page mentions your CDN provider, the request never reached your host. You can also put your CDN into development or bypass mode for a few minutes. If the error disappears, the CDN layer is responsible.
Fix it in the CDN dashboard rather than in WordPress. Purge the full cache so stale error responses are discarded. Review any firewall or page rules you added recently and disable the newest one. Check whether you are passing a very long custom header through the proxy. Raise the proxy’s header limit if the provider allows it.
Verify by turning the CDN back on and loading the page again. Watch for the error returning as caching resumes. If it returns only with the CDN active, raise a support ticket with the provider and quote the reference code. If the origin server fails even with the CDN bypassed, continue to Step 7.
Step 7: Raise the Request Header Limits on Your Server
This step addresses the server header limit cause directly. Apache caps a single header field at 8190 bytes by default. It also accepts only 100 header fields unless told otherwise. Nginx stores large headers in four 8 KB buffers by default, and one field must fit one buffer. A request that exceeds those figures is answered with 400.
Confirm the cause from the server log. Nginx writes a line about a “client sent too long header line” or a request header being too large. Apache records a similar note in the error log. Your host’s control panel usually exposes these logs under a logs or errors section. A matching entry at the time of the failure confirms the limit was hit.
Server config files can take a site offline if they are wrong. Back up the file first. Ask your host to apply the change if you are unsure. On nginx, raise the buffer setting in the server block, for example large_client_header_buffers 4 16k;. On Apache, raise the field size with LimitRequestFieldSize 16380 in your virtual host. Reload the web server so the new value takes effect. Treat this as breathing room rather than a cure, then reduce the number of cookies your site sets.
Verify by logging in and loading the dashboard. A logged-in request carries the largest headers, so it is the best test. Check the server log again and confirm no new header warnings appear. If the limit was already generous and the log is clean, the cause lies elsewhere. Go to Step 8.
Step 8: Fix 400 Responses From the WordPress REST API
This step addresses a REST API request with a missing or invalid value. The block editor saves your work through the REST API. Every endpoint declares the values it will accept. A missing or wrongly typed value makes the API refuse the request with status 400.
Confirm the cause inside your browser tools. Open the editor, press F12, and select the Network tab. Try to save the post and watch the list of requests. Click the request that shows status 400 and read its response. The response names the value the API rejected, which usually points at one plugin.
Fix it with a standard conflict test, done safely. Run the test on a staging copy if you have one, and take a backup first either way. Deactivate your plugins, then reload the editor and try saving again. If saving works, switch the plugins back on one by one until the error returns. The last plugin you enabled is the cause, so update it or replace it. Also clear any page and object caches, because a stale editor script can send outdated values.
Verify by saving a short test post from a clean browser window. The post should save with no notice and no 400 in the Network tab. If the editor still fails and the response mentions a JSON problem, read our guide to the not a valid JSON response error. If the whole site returns 400 rather than just the editor, revisit Step 1 and Step 7 together.
Best Practices to Prevent the 400 Bad Request Error in Future
Each habit below removes one of the causes listed earlier. Together they keep requests small, clean and predictable.
Keep the number of cookies your site sets as low as you can. Every active plugin that stores a cookie adds to each request. Remove plugins you no longer use instead of leaving them deactivated. Review your consent banner, analytics and cart tools once a quarter. Fewer cookies means the header limit stays comfortably out of reach.
Keep your slugs and links plain. Use lowercase letters, digits and hyphens in every slug. Avoid spaces, accents, ampersands and quotation marks. Audit your menus and redirects after any site redesign. A single broken link is enough to show visitors a 400 page.
Test security rules before they reach live traffic. Build a staging copy of your site and enable new firewall rules there first. Watch the block log for a day before you trust a new rule. Keep an allow list for your own office address so you never lock yourself out. Ask your host to document any server-level rules they apply on your behalf.
Record your server limits somewhere you can find them. Note the header and buffer values your host uses for your account. Review them when you add a plugin that sets long cookies or tokens. Raise them deliberately rather than in a panic during an outage. Keep the change in a short runbook so the next person understands it.
Keep the whole stack current and backed up. Update WordPress, plugins and themes on a regular schedule. Keep PHP on a version your host still supports. Run scheduled backups and confirm that a restore actually works. Add simple uptime monitoring so you learn about errors before customers do. If problems keep returning, our guide to page speed issues in WordPress covers related server housekeeping.
Conclusion: Keeping Your WordPress Site Free of 400 Errors
A 400 Bad Request error always means the same thing. The server read your request and judged it malformed. WordPress never got the chance to run. That is why the page looks so bare and unhelpful.
The signs are easy to read once you know them. Plain text wording, no WordPress branding, and a fault that often follows one browser. A dashboard that fails while the front end works points at login cookies. A failed save in the block editor points at the REST API.
The causes fall into a short list. Oversized or corrupted cookies, a malformed address, and tight server header limits. A firewall false positive, a REST API value, a stale DNS record, a browser extension, or a CDN layer. Each one has a matching step in this guide.
The fix process moves from safe to deep. Clear cookies, check the address, clear the cache, and flush DNS. Then test your firewall, bypass your CDN, raise header limits, and finally debug the REST API. Back up before any step that touches server files or plugins.
Prevention is mostly housekeeping. Keep cookies few, slugs plain, and security rules tested. Document your server limits and keep your software current. If a database message appears instead of a 400, read our guide on how to fix error establishing a database connection in WordPress. You can also read the official nginx header buffer documentation and the Apache LimitRequestFieldSize reference for the exact limits.

James is an experienced WordPress and WooCommerce specialist with over 10 years of practical experience. At WPChatSupport, he creates clear guides that help website owners fix WordPress issues, improve speed, secure their sites, and manage WooCommerce stores with confidence. His expertise includes store setup, plugin configuration, theme customization, payment gateway integration, and website troubleshooting. Through simple and helpful content, James supports users in solving technical problems and following best practices for online business growth.